During the CNN debate last week between President Joe Biden and former President Donald Trump, a startling moment came not from the candidates, but from moderator Jake Tapper. Tapper stated that grocery prices had risen by 20 percent since President Biden took office, a figure that many viewers found hard to believe.
The Reality of Rising Prices
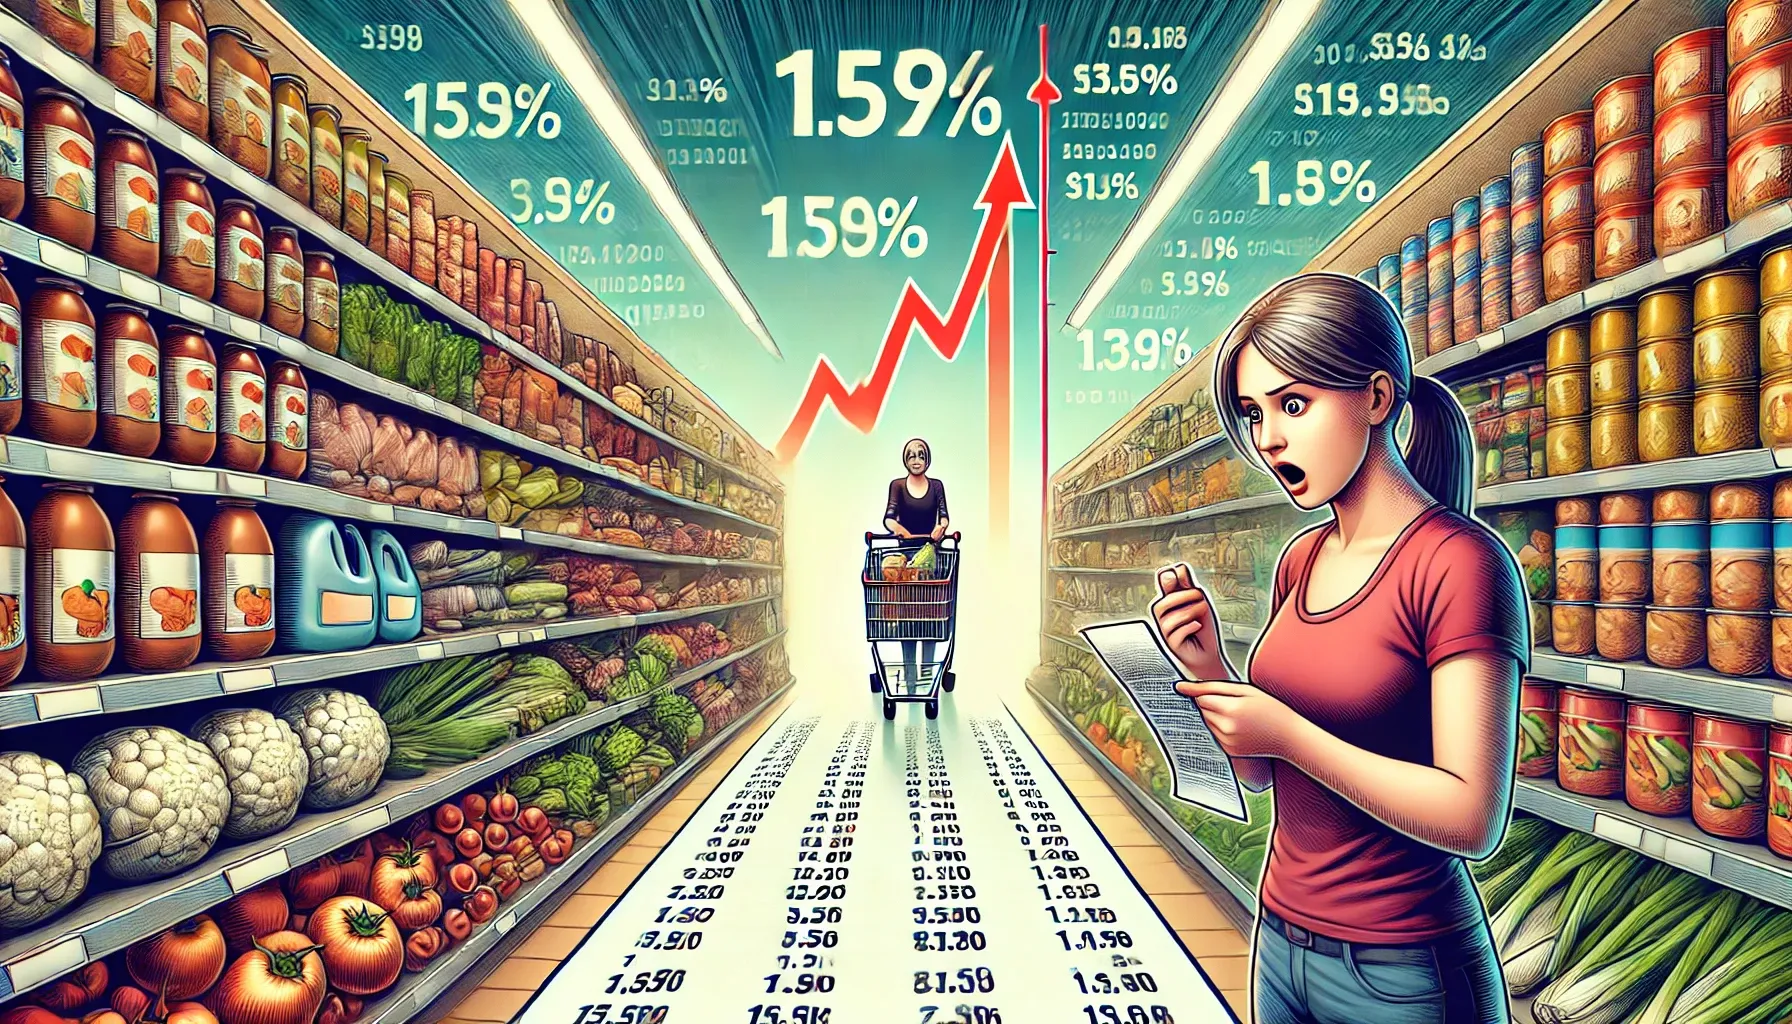
Tapper’s claim is backed by the Bureau of Labor Statistics (BLS), which reports a precise increase of 20.8 percent in grocery prices. However, this statistic conflicts with the experiences of many Americans, who report much higher increases in their grocery bills. Social media is flooded with posts showing receipts where grocery prices have risen by anywhere from two to ten times the BLS figure.
In one viral video, a man demonstrated that a basket of 45 items, which cost him $145 two years ago, now costs $414 at Walmart – a 185 percent increase. Even accounting for no inflation in the first year, this represents an annualized increase of 61 percent, which suggests hyperinflation.
Official Data vs. Real Experience
The discrepancy between official data and personal experiences is significant. According to the Grocery Price Index, overall grocery prices have risen by 35 percent over three years, which is closer to people’s experiences but still seems underestimated. CBS News offers a grocery-price checker that reveals item-by-item price increases typically ranging from 30 to 40 percent.
On June 28, the Bureau of Economic Analysis (BEA) reported that Personal Consumption Expenditures (PCE), another measure of inflation favored by the Federal Reserve, showed only a 0.2 percent increase in May, annualized at 2.4 percent. Over three years, this equates to a 16 percent increase in prices.
Understanding the Discrepancies
We live in an era where price information is readily available. How can there be such a large gap between real-world experiences and official data? Several factors could explain this:
- Shrinkflation: Products are often sold in smaller packages for the same price, effectively raising prices without being reflected in inflation statistics.
- Substitution: Consumers switch to cheaper alternatives, like chicken instead of beef, or shop at discount stores instead of premium ones, which complicates price tracking.
- Service Fees and New Charges: New fees and charges that weren't previously part of the pricing structure might not be included in traditional inflation measures.
The BLS and BEA use methodologies that might not fully capture these nuances. For example, the PCE is based on data from businesses and trade organizations, while the Consumer Price Index (CPI) is based on surveys from consumers. The PCE also uses a price deflator to normalize data, which can introduce inaccuracies.
The Real Impact on Consumers
Regardless of the methodology, the perception of rising grocery prices impacts consumer behavior. People on tight budgets feel the pinch more acutely, and the shift in shopping habits reflects this. The disconnect between official inflation statistics and consumer experiences fuels distrust in reported data.
Wall Street's dependence on these figures introduces an additional layer of complexity. Traders and Fed officials use this data to make decisions that influence the economy. A lower reported inflation rate can lead to lower interest rates, which benefits the stock market but might not reflect the reality faced by consumers.
Conclusion
The discrepancy between reported inflation and consumer experience suggests that traditional methods of measuring inflation might be outdated. While official data provides a broad overview, it often fails to capture the real impact on consumers.
For a more accurate understanding, individuals should look at their own spending and compare prices over time. This personal data can offer a clearer picture of how much grocery prices have truly increased.